go-plot documentation
go-plot draws matplotlib’s figures in pure Go. Its object model and its defaults are matplotlib’s — figure size, fonts, colour cycle, margins, tick placement and tick labels — so a figure looks the way a matplotlib user expects, and the parts that can be equal are tested equal to matplotlib: tick locations and labels on 408 real axes, eight colormaps entry for entry, and the layout of 30 figures.
What Go adds: one static binary, js/wasm, no Python, no cgo, and TeX labels
set by a real TeX math typesetter, go-tex/math.
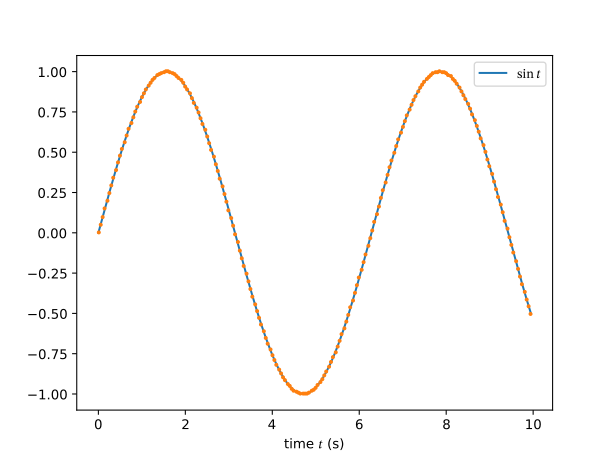
These pages describe go-plot/plot v0.1.0. Every figure in them was drawn by that version, from the code shown beside it.
Install
go get github.com/go-plot/plot@v0.1.0The module needs Go 1.27.2 or later. It is pure Go (CGO_ENABLED=0) and builds
for the six 64-bit Linux targets, 386, arm, js/wasm and wasip1/wasm.
The pages
| Page | What it says |
|---|---|
| Getting started | a first figure, saved as PNG and SVG, and shown in a notebook |
| The API | Figure, Subplots and Axes, options for keyword arguments, data as any, and why it has matplotlib’s shape |
| Plot types | every plot type of v0, each with the code that drew it |
| Exactness | ticks, colours and layout: what equals matplotlib, and how it is checked |
| TeX labels | math in titles, labels, legends and text, set by a TeX typesetter |
| Performance | go-plot against matplotlib 3.11.2, and how it was measured |
| Differences | what does not equal matplotlib, and what is not in v0 |
Built on
go-widgets/painter (compositing),
go-gfx/gfx (anti-aliased coverage),
go-opentype (DejaVu Sans, glyph outlines,
kerning), go-tex/math (TeX) and
go-ndarray (data).
go-notebook shows a figure through
Figure.Display.
Created on by tannevaled
Modified on by tannevaled