TeX labels
Any string go-plot draws — a title, an axis label, a legend entry, a colorbar
label, Text, Annotate — may contain TeX math between dollar signs:
ax.SetXLabel(`time $t$ (s)`)
ax.Plot(x, y, plot.Label(`$e^{-t/4}\cos 2t$`))
Use Go’s raw strings (backquotes), so that backslashes reach TeX unescaped.
A TeX typesetter, not mathtext
matplotlib sets $...$ with mathtext, its own approximation of TeX.
go-plot sets it with go-tex/math, a real TeX
math typesetter using the OpenType MATH table of STIX Two Math: fractions,
radicals, big operators, limits, matrices and \left...\right are laid out as
TeX lays them out, which mathtext only approximates. go-tex/math’s output is
parsed back into paths and scaled to the label’s size, so TeX is drawn as
outlines in both PNG and SVG and needs no font installed.
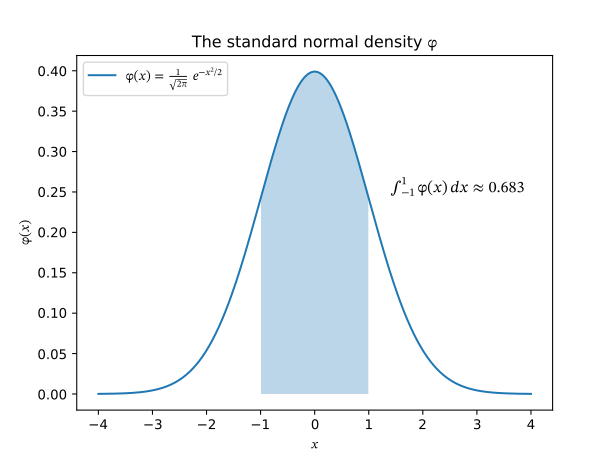
package main

import (
	"math"

	"github.com/go-plot/plot"
)

func init() { register("tex", tex) }

func tex() *plot.Figure {
	x := linspace(-4, 4, 400)
	y := make([]float64, len(x))
	for i, v := range x {
		y[i] = math.Exp(-v*v/2) / math.Sqrt(2*math.Pi)
	}
	fig, axs := plot.Subplots(1, 1)
	ax := axs[0][0]
	ax.Plot(x, y, plot.Label(`$\varphi(x) = \frac{1}{\sqrt{2\pi}}\, e^{-x^2/2}$`))
	ax.FillBetween(x, y, nil, plot.Where(between(x, -1, 1)), plot.Alpha(0.3))
	ax.Text(1.4, 0.25, `$\int_{-1}^{1} \varphi(x)\,dx \approx 0.683$`, plot.FontSize(12))
	ax.SetTitle(`The standard normal density $\varphi$`)
	ax.SetXLabel(`$x$`)
	ax.SetYLabel(`$\varphi(x)$`)
	ax.Legend(plot.Loc("upper left"))
	return fig
}

func between(x []float64, lo, hi float64) []bool {
	m := make([]bool, len(x))
	for i, v := range x {
		m[i] = v >= lo && v <= hi
	}
	return m
}
Tick labels keep matplotlib’s look
The one exception is \mathdefault{...}, which is what matplotlib’s tick
formatters emit (10^{3}, 2\times10^{1}). It is set in DejaVu Sans with
mathtext’s own superscript rules (shift = max(sup1 · x-height, depth +
x-height/4), scripts at 0.7 size), so tick labels match matplotlib’s look and
position. The decades on the log-log figure
are set this way.
Plain text
Text outside dollar signs is set in DejaVu Sans, matplotlib’s default
font, from go-opentype/fonts, with kerning from DejaVu’s GPOS and kern tables.
Glyphs are drawn as filled outlines, so rotated labels and SVG output need no
font. Positions follow matplotlib’s Text._get_layout (line metrics from the
OS/2 table, alignment, rotation, anchoring), and like Agg the pen is put on a
whole pixel. How the pixels of text differ from matplotlib’s is on
Differences.
Cost
STIX Two Math is parsed only when a label contains TeX: a figure without any does not pay for it (performance).
Replacing the renderer
Figure.Text is a text.Renderer with two methods, Layout(s, size) and
LineMetrics(size). Setting another one changes the fonts of the whole figure.
Created on by tannevaled
Modified on by tannevaled