Getting started
Install
go get github.com/go-plot/plot@v0.1.0Go 1.27.2 or later. Nothing else: no Python, no C library, no font to install. The fonts (DejaVu Sans for text, STIX Two Math for TeX) are compiled in.
A first figure
This is the example of go-plot’s README. It plots a sine as a line, then the same points as markers, labels the x axis with some TeX, adds a legend, and writes a PNG to standard output:
package main

import (
	"math"
	"os"

	"github.com/go-plot/plot"
)

func main() {
	x := make([]float64, 200)
	y := make([]float64, 200)
	for i := range x {
		x[i] = float64(i) / 20
		y[i] = math.Sin(x[i])
	}
	fig, axs := plot.Subplots(1, 1)
	ax := axs[0][0]
	ax.Plot(x, y, plot.Label(`$\sin t$`))
	ax.Plot(x, y, plot.Marker("o"), plot.LineStyle("None"), plot.MarkerSize(2))
	ax.SetXLabel(`time $t$ (s)`)
	ax.Legend()
	fig.SavePNG(os.Stdout)
}
go run . > sine.pngThe same figure, saved with SaveSVG instead:
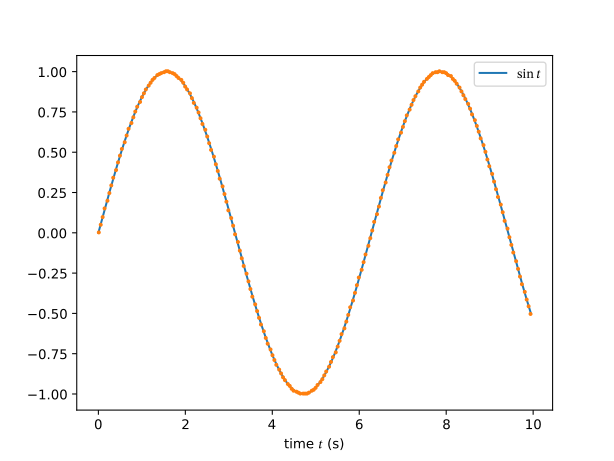
package main

import (
	"math"

	"github.com/go-plot/plot"
)

func init() { register("quickstart", quickstart) }

// The README's example, with SaveSVG in place of SavePNG.
func quickstart() *plot.Figure {
	x := make([]float64, 200)
	y := make([]float64, 200)
	for i := range x {
		x[i] = float64(i) / 20
		y[i] = math.Sin(x[i])
	}
	fig, axs := plot.Subplots(1, 1)
	ax := axs[0][0]
	ax.Plot(x, y, plot.Label(`$\sin t$`))
	ax.Plot(x, y, plot.Marker("o"), plot.LineStyle("None"), plot.MarkerSize(2))
	ax.SetXLabel(`time $t$ (s)`)
	ax.Legend()
	return fig
}
Read it as matplotlib:
| go-plot | matplotlib |
|---|---|
fig, axs := plot.Subplots(1, 1) | fig, axs = plt.subplots(1, 1, squeeze=False) |
ax := axs[0][0] | ax = axs[0][0] |
ax.Plot(x, y, plot.Label(...)) | ax.plot(x, y, label=...) |
plot.Marker("o"), plot.LineStyle("None"), plot.MarkerSize(2) | marker="o", linestyle="None", markersize=2 |
ax.SetXLabel(...) | ax.set_xlabel(...) |
ax.Legend() | ax.legend() |
fig.SavePNG(w), fig.SaveSVG(w) | fig.savefig(f, format="png"), format="svg" |
The figure is matplotlib’s default: 6.4 × 4.8 inches at 100 dpi, so 640 × 480
pixels, with the tab10 colour cycle (the line is C0, the markers C1).
plot.FigSize(w, h) and plot.DPI(d) change it:
fig, axs := plot.Subplots(2, 2, plot.FigSize(8, 6), plot.DPI(150))Data
Data arguments take []float64, []float32, []int, []int32, []int64,
a scalar, or a *ndarray.Array of any of go-ndarray’s
dtypes. A type that cannot be plotted, or x and y of different lengths,
panics: both are programming errors, as an index out of range is. See
the API.
In a notebook
fig.Display() returns the figure in every format a notebook front end may
show, keyed by MIME type: image/svg+xml and image/png. It is the display
contract of the go-notebook kernel,
so a cell whose last expression is a figure shows it; it is the notebook’s
plt.show().
Next
- The API: the object model and why it has this shape.
- Plot types: every plot type, with the code that drew it.
Created on by tannevaled
Modified on by tannevaled