go-plot is the plotting library of the Go scientific stack built on go-ndarray. Its object model and defaults are matplotlib's — figure size, fonts, colour cycle, margins, tick placement and tick labels — so a figure looks the way a matplotlib user expects. It writes SVG and PNG, sets labels with a real TeX math typesetter, and needs no Python and no cgo: one static binary, js/wasm included.
func main() {
	x := make([]float64, 200)
	for i := range x {
		x[i] = float64(i) / 199 * 10
	}
	sin, damped := make([]float64, len(x)), make([]float64, len(x))
	for i, v := range x {
		sin[i] = math.Sin(v)
		damped[i] = math.Exp(-v/4) * math.Cos(2*v)
	}

	fig, axs := plot.Subplots(1, 1, plot.FigSize(6.4, 4))
	ax := axs[0][0]
	ax.Plot(x, sin, plot.Label(`$\sin t$`))
	ax.Plot(x, damped, plot.Label(`$e^{-t/4}\cos 2t$`), plot.LineStyle("--"))
	ax.FillBetween(x, damped, nil, plot.Alpha(0.2))
	ax.SetTitle(`Two signals, labelled in TeX`)
	ax.SetXLabel(`time $t$ (s)`)
	ax.SetYLabel("amplitude")
	ax.Grid(true)
	ax.Legend()
	if err := fig.SaveSVG(os.Stdout); err != nil {
		panic(err)
	}
}
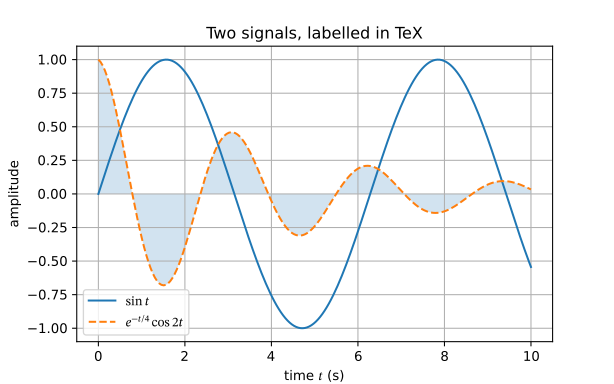
This is the SVG it writes, unedited: two lines from the colour cycle, a dashed style, a translucent fill, a grid, a legend placed where it covers the least data, and labels set in TeX. Twelve reference figures drawn by both go-plot and matplotlib put every axes frame and every tick mark on the same pixel, and after TightLayout within 2 pixels.
A census of 339 scientific notebooks ranks plotting first among the things that keep them from moving to Go, and most of them write fig, ax = plt.subplots(); ax.plot(...). go-plot is that API, under the same names, with Go's argument style.
Subplots, Plot, SetXLabel, Legend, SetTitle, TightLayout, SetYLim, Axhline: every call the census ranks, named as in matplotlib. Keyword arguments become options: plot.Color("C1").
Tick locations and labels, colormaps, named colours, and the layout of figures are compared with fixtures generated by matplotlib 3.11.2 itself, exactly unless stated.
$...$ is typeset by go-tex/math with STIX Two Math: fractions, radicals, big operators, limits and matrices, as TeX lays them out.
Every data argument takes []float64, other numeric slices, or a *ndarray.Array of any of its thirteen dtypes.
SaveSVG writes vector paths, SavePNG anti-aliased pixels, and Display hands a notebook kernel both.
No Python, no C. It builds for the six 64-bit Linux targets, 386, arm, js/wasm and wasip1/wasm.
Gated in CI on three operating systems, with six architectures.
Every repository of the organization.
The fixtures are written by scripts that call matplotlib, committed, and compared in the tests. What is not equal — text rasterisation, contour vertices, image resampling — is listed in the documentation, not hidden.
Tick locations, labels and offset text on 408 axes of real figures (4 sizes, 37 linear and 14 log ranges): every location bit for bit, every label character for character.
45 MaxNLocator, 42 LogLocator, 72 ScalarFormatter and 25 LogFormatterSciNotation cases a default figure never reaches, exact.
viridis, plasma, inferno, magma, cividis, gray, coolwarm, RdBu (and _r): 1008 samples per map compared as floats and as bytes.
All 148 CSS4 colours, the 10 tab: colours, single letters, C0–C9, grey levels, short and long hex: exact.
15 kinds of figure at two sizes: every Axes position and view limit to 1e-9 relative, every tick label exactly. After TightLayout (6 kinds at two sizes), every Axes edge within 0.005 of the figure.
Twelve reference figures drawn by both put every axes frame and tick mark on the same pixel, and after TightLayout within 2 pixels; two deliberately shifted figures must fail, and do.
In-process time, medians of 9 interleaved fresh-process runs per case on a shared, loaded 16-core Apple M4 Max, 2026-10-10. Python's start and import matplotlib.pyplot (about 0.5 s) are not counted.
| figure | go-plot | matplotlib 3.11.2 | ratio |
|---|---|---|---|
| 1e6-point line → PNG | 0.055 s | 0.065 s | 1.2x |
| 1e6-point line → SVG | 0.019 s | 0.053 s | 2.8x |
| 1000² imshow → PNG | 0.025 s | 0.042 s | 1.7x |
| 1000² imshow → SVG | 0.020 s | 0.042 s | 2.1x |
The library: Figure, Axes and every plot type, with ticker (tick locations and labels), colors (the cycle, eight colormaps, norms), contour (marching squares), render (raster and vector SVG back-ends) and text (DejaVu Sans, and TeX through go-tex/math).
The documentation (Hugo + Hextra): getting started, the API and why it has this shape, every plot type with the code that drew it, what is exact against matplotlib, TeX labels, performance, and the differences. Source →
Logos and icons for the organization, in SVG / PNG / JPG / ICO / ICNS across colour, white and black variants.
go-plot draws the data of go-ndarray, and a go-notebook cell shows a figure through Display. What is not in v0 yet — symlog and date axes, constrained_layout, boxplot and pie, PDF, windows — is listed in the documentation.
 go-plot